With the increasing diversity as well as sheer number of available devices, the potential of using them in combination in device ecologies is big – particularly for facilitating more flexible and more natural visual data analyses.
The Thesis in a Nutshell
Device ecologies can enable more flexible workflows for visual data analysis by incorporating the devices that are most suited for the current situation and handle the overall interface in a more natural way. Further, device ecologies can be available and set up anywhere, anytime. The work presented in this thesis contributes to different aspects relevant for supporting visual data analysis in device ecologies: Responsive visualization design can provide more flexible data representations that can be used on a wide range of devices and contexts. Incorporating device roles for providing interaction and visualization concepts allows to better support specific analysis workflows within a used device ensemble. And, novel interaction concepts in combination with automated optimizations allow to handle and simplify the dynamic aspects of device ecologies for analysts.
Quick Access
Defense
The successful defense of the PhD thesis took take place on July 7, 2021.
The Thesis Document
@phdthesis{fixme,
author = {Tom Horak},
title = {Visual Data Analysis in Device Ecologies},
year = {2021},
month = {7},
location = {Dresden},
numpages = {283},
url = {https://nbn-resolving.org/urn:nbn:de:bsz:14-qucosa2-758986},
publisher = {Qucosa - Technische Universit\"{a}t Dresden}
}Weitere Materialien
Fast-Forward: Video Wall
Responsive Matrix Cells
Watch+Strap
When David meets Goliath
VisTiles
Vistribute
Main Contributions
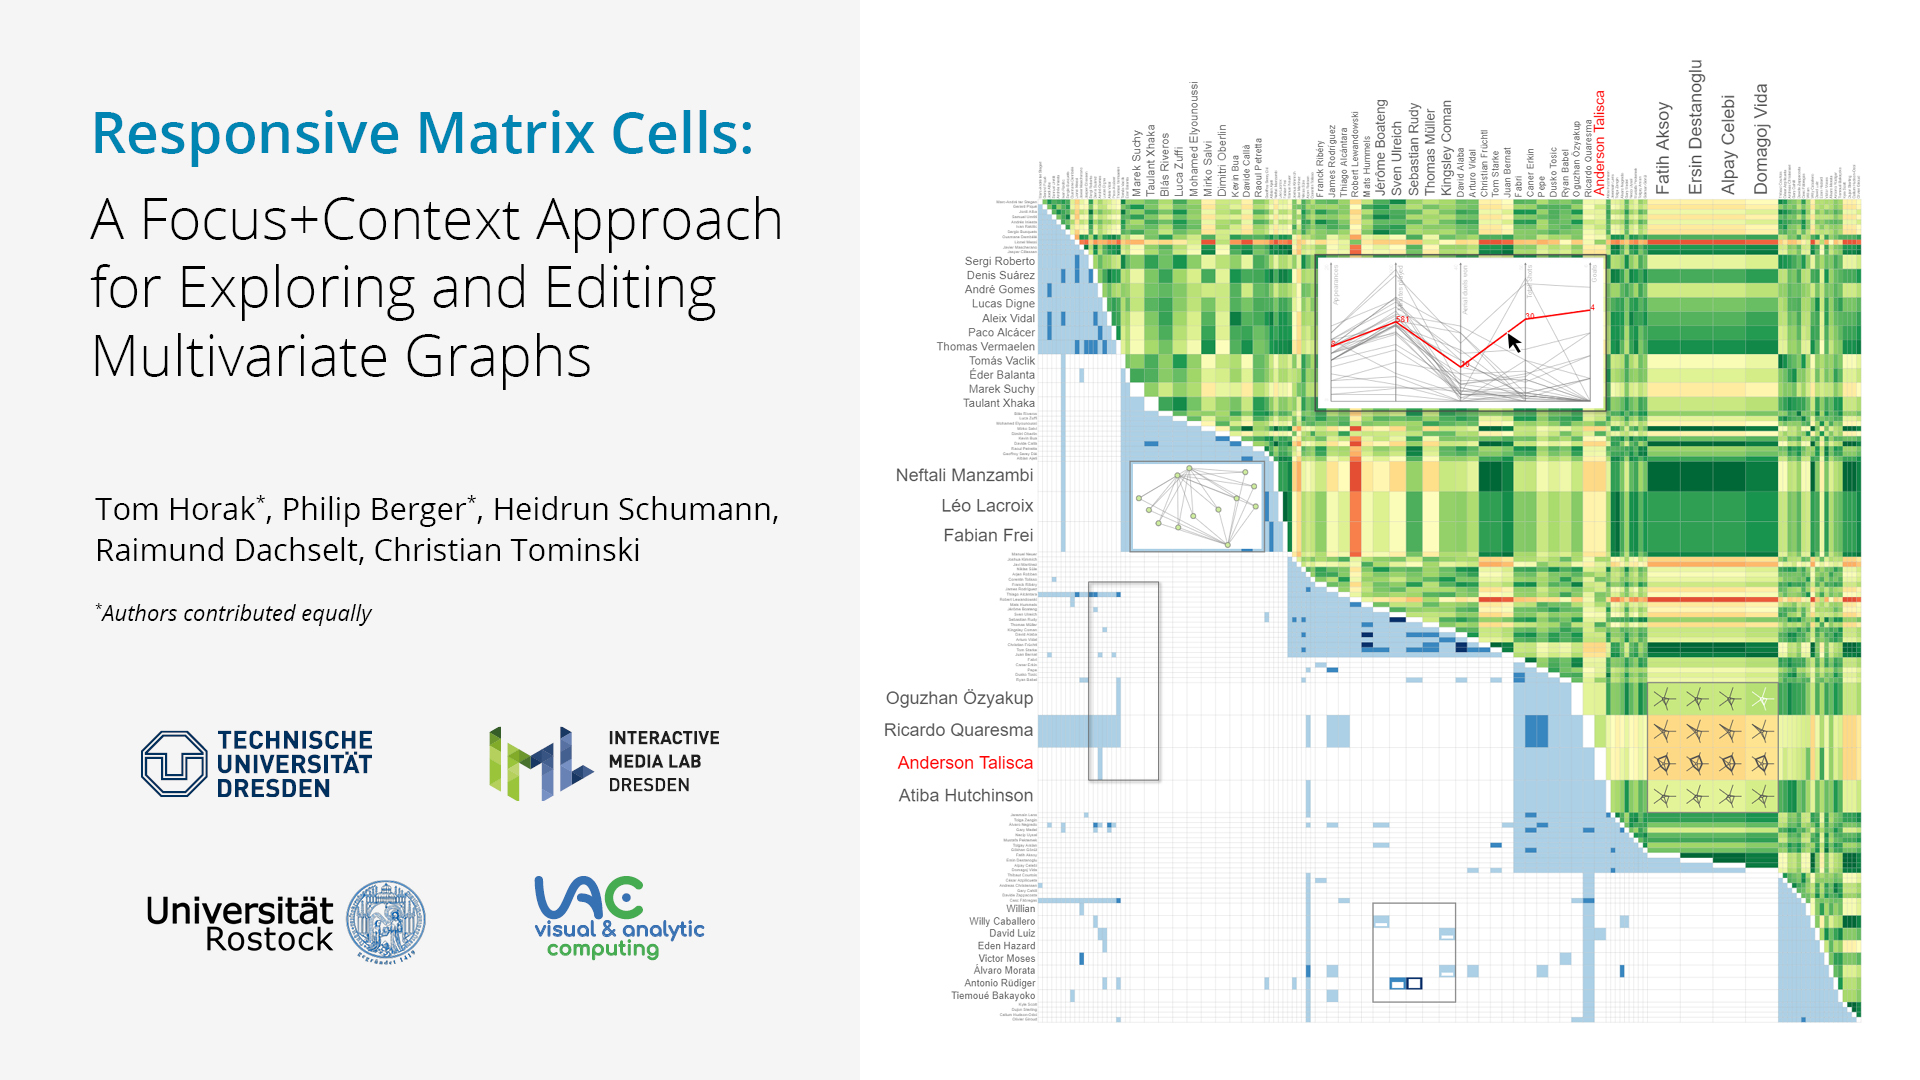
Adapting Visualizations for Heterogeneous Devices
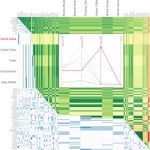
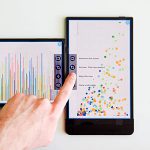
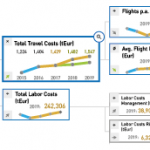
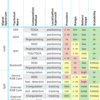
Before placing visualizations on different devices within device ecologies, it must be considered how visualizations can be adapted for all the different devices in general. In order to inform an improved understanding, my dissertation project included an analytical exploration of the notion of Responsive Visualization, which is yet underexplored in the literature. Following these generalized considerations, the aspects of responsiveness have then been explored specifically for multivariate graph visualization. Here, as the major contribution, the Responsive Matrix Cells was introduced, which is a focus+context approach for matrix visualization that allows embedding responsive detail visualizations in local focus areas. In sum, this part of my dissertation project provides an improved understanding of how visualizations can adapt to different contexts and support data analysis within a compact space.
@article{Horak2020ResponsiveMatrixCells,
author = {Tom Horak and Philip Berger and Heidrun Schumann and Raimund Dachselt and Christian Tominski},
title = {Responsive Matrix Cells: A Focus+Context Approach for Exploring and Editing Multivariate Graphs},
journal = {IEEE Transactions on Visualization and Computer Graphics},
issue = {27},
number = {2},
year = {2021},
month = {2},
location = {Salt Lake City, UT, USA},
pages = {1644--1654},
doi = {10.1109/TVCG.2020.3030371},
publisher = {IEEE}
}Weitere Materialien
, Video, Online Demo
Analysis Workflows in Dedicated Device Ensembles
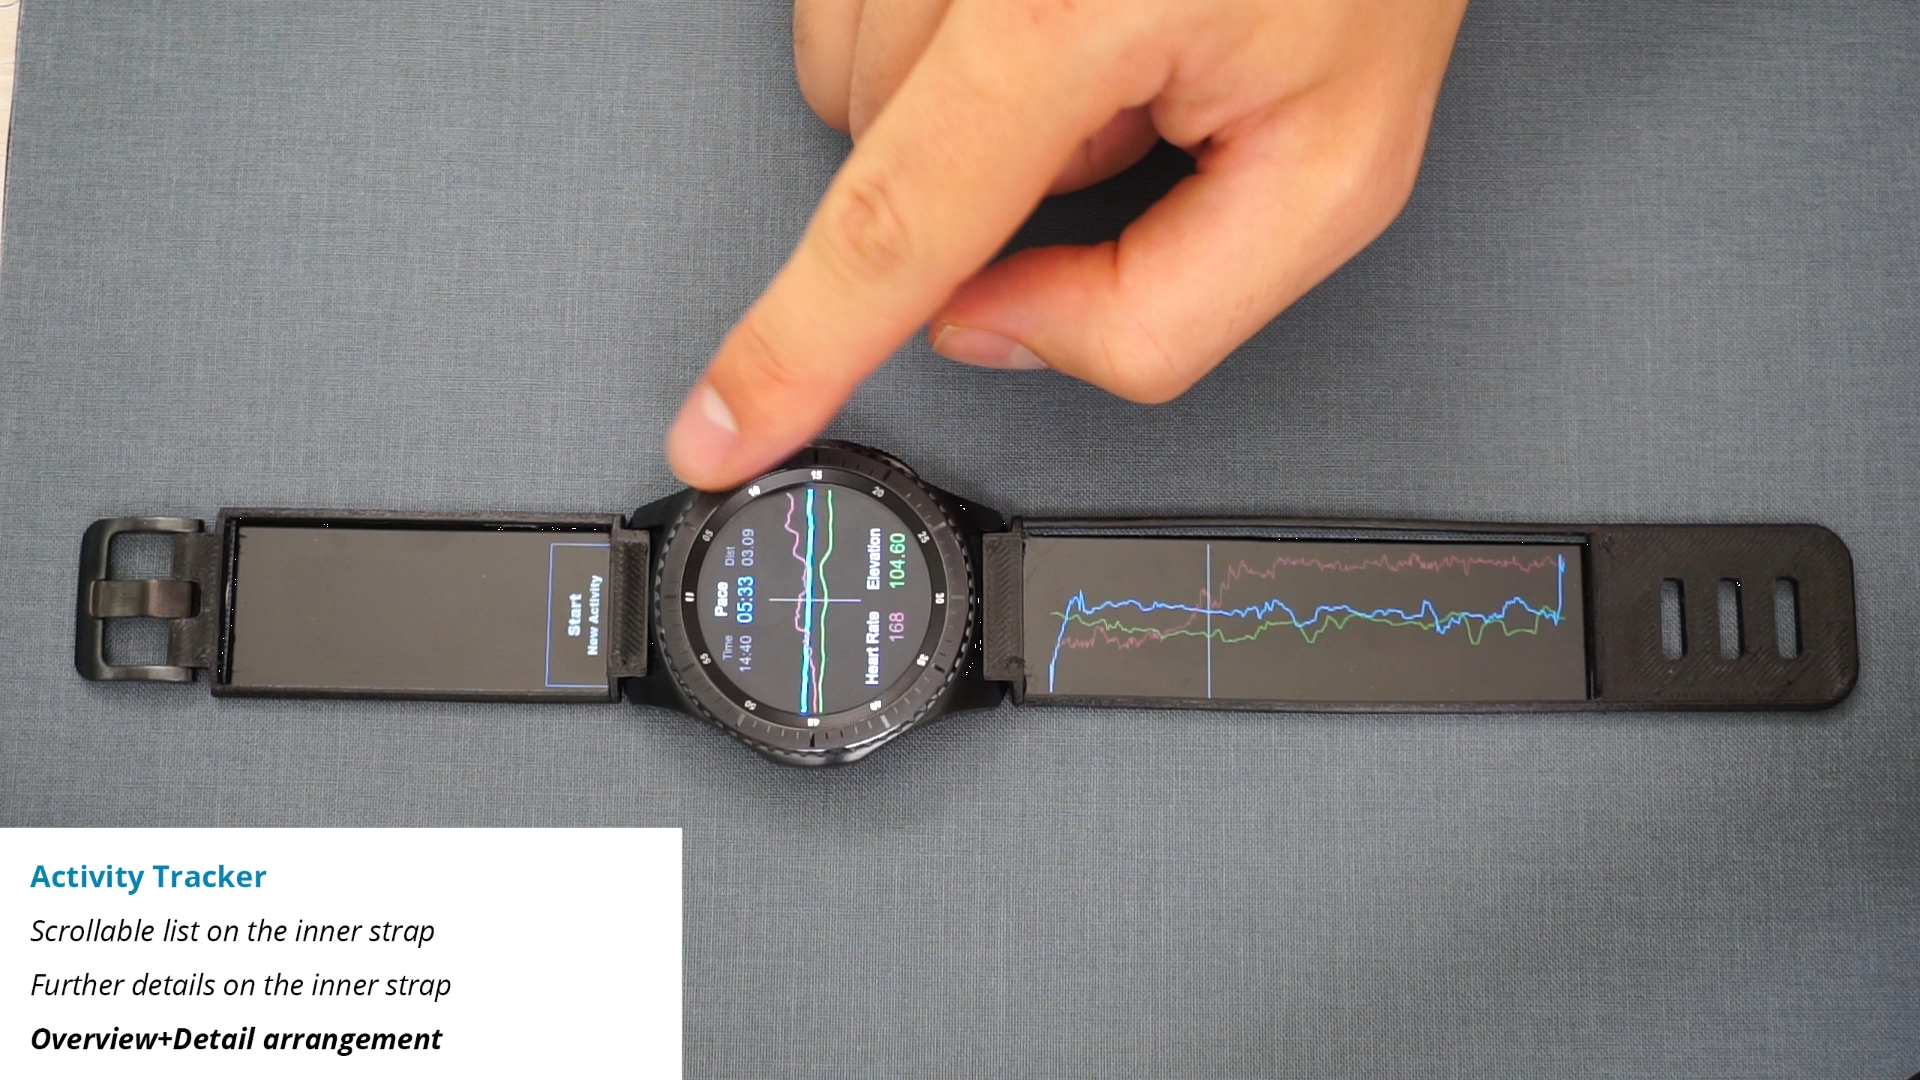
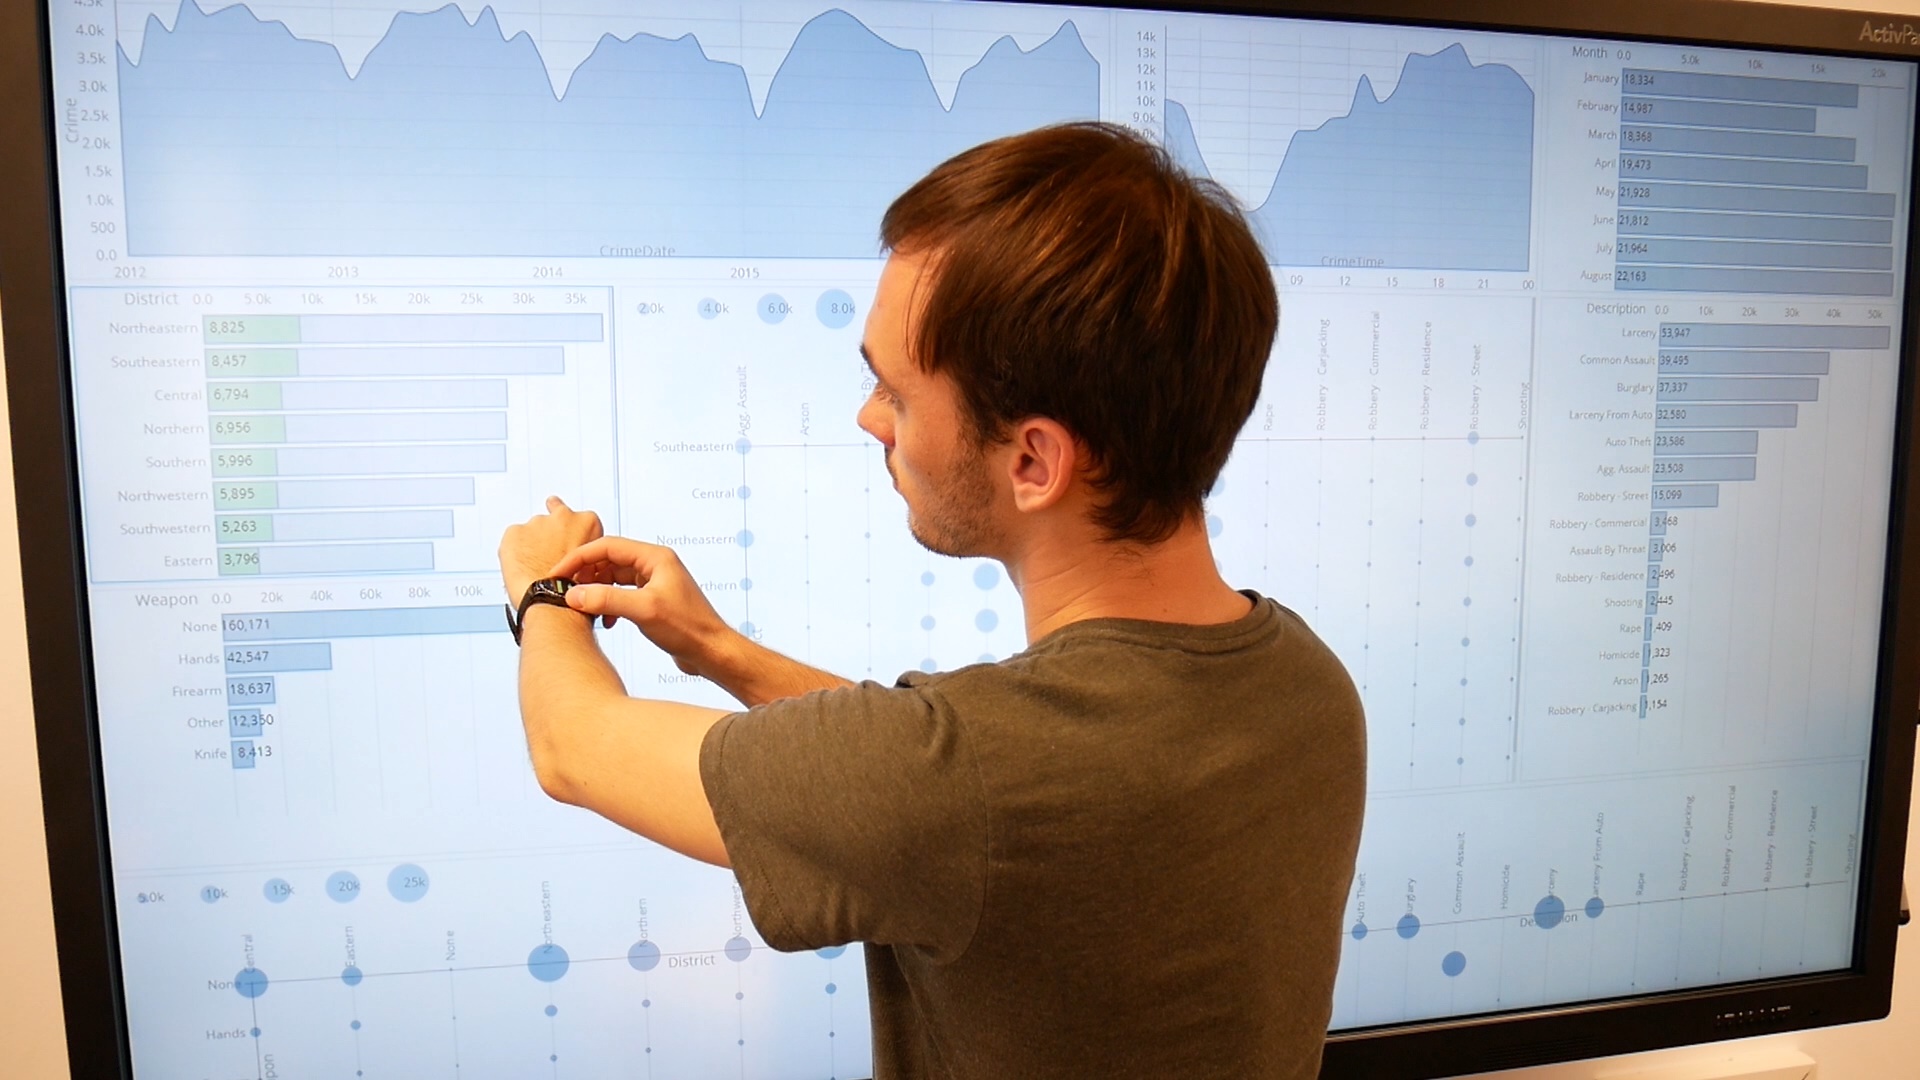
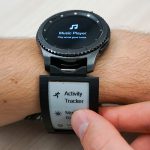
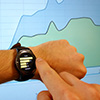
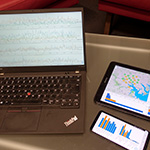
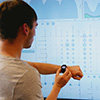
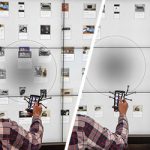
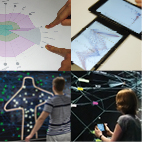
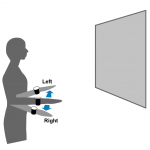
With the strategies for bringing visualizations to heterogeneous devices in mind, the focus can now be shifted to using specific device ensembles for data analysis. For this, I considered two specific ensembles. In the first, the novel display combination of smartwatch and display-equipped watchstraps and its usage for personal visualization was proposed. With this self-contained ensemble called Watch+Strap, concepts for using the different displays in combination were developed and tested. For the second ensemble, it was investigated how the contrary device types of smartwatch and large display—like David and Goliath—can be used in a complementing synergy for visual data analysis. Following the design of a conceptual framework, this device setup was studied more extensively with a focus on which workflows analysts adopt while working in this environment. Both explorations provide novel concepts for mobile visualization and visualization beyond the desktop, as well as a better understanding of how device roles can aid and support common exploration workflows when investigating multivariate data sets in such ensembles.
@inproceedings{Klamka2020,
author = {Konstantin Klamka and Tom Horak and Raimund Dachselt},
title = {Watch+Strap: Extending Smartwatches with Interactive StrapDisplays},
booktitle = {Proceedings of the CHI Conference on Human Factors in Computing Systems},
year = {2020},
month = {4},
location = {Honolulu, Hawaii, USA},
pages = {72:1--72:15},
doi = {10.1145/3313831.3376199},
publisher = {ACM}
}Weitere Materialien
, Video
@inproceedings{Horak2018,
author = {Tom Horak and Sriram Karthik Badam and Niklas Elmqvist and Raimund Dachselt},
title = {When David Meets Goliath: Combining Smartwatches with a Large Vertical Display for Visual Data Exploration},
booktitle = {Proceedings of the CHI Conference on Human Factors in Computing Systems},
year = {2018},
month = {4},
location = {Montreal, QC, Canada},
pages = {19:1--19:13},
doi = {10.1145/3173574.3173593},
url = {https://doi.org/10.1145/3173574.3173593},
publisher = {ACM}
}Weitere Materialien
, Video
Analysis Interfaces for Dynamic Device Ecologies
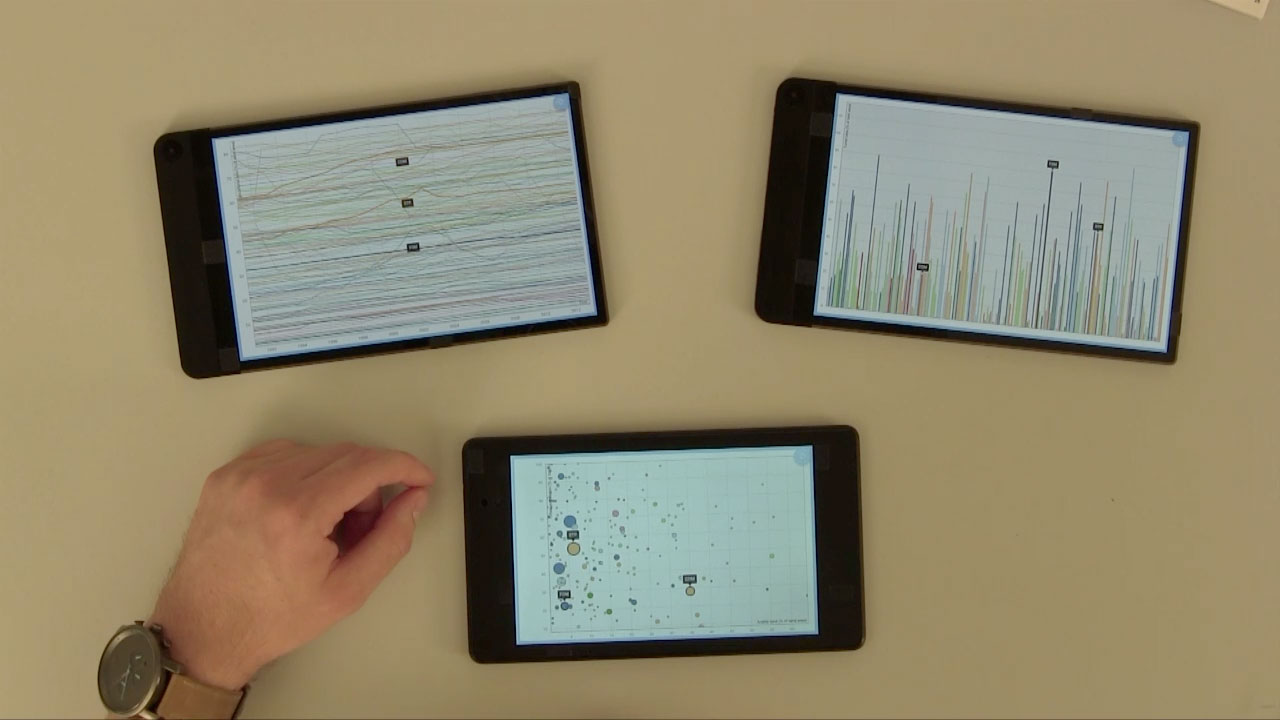
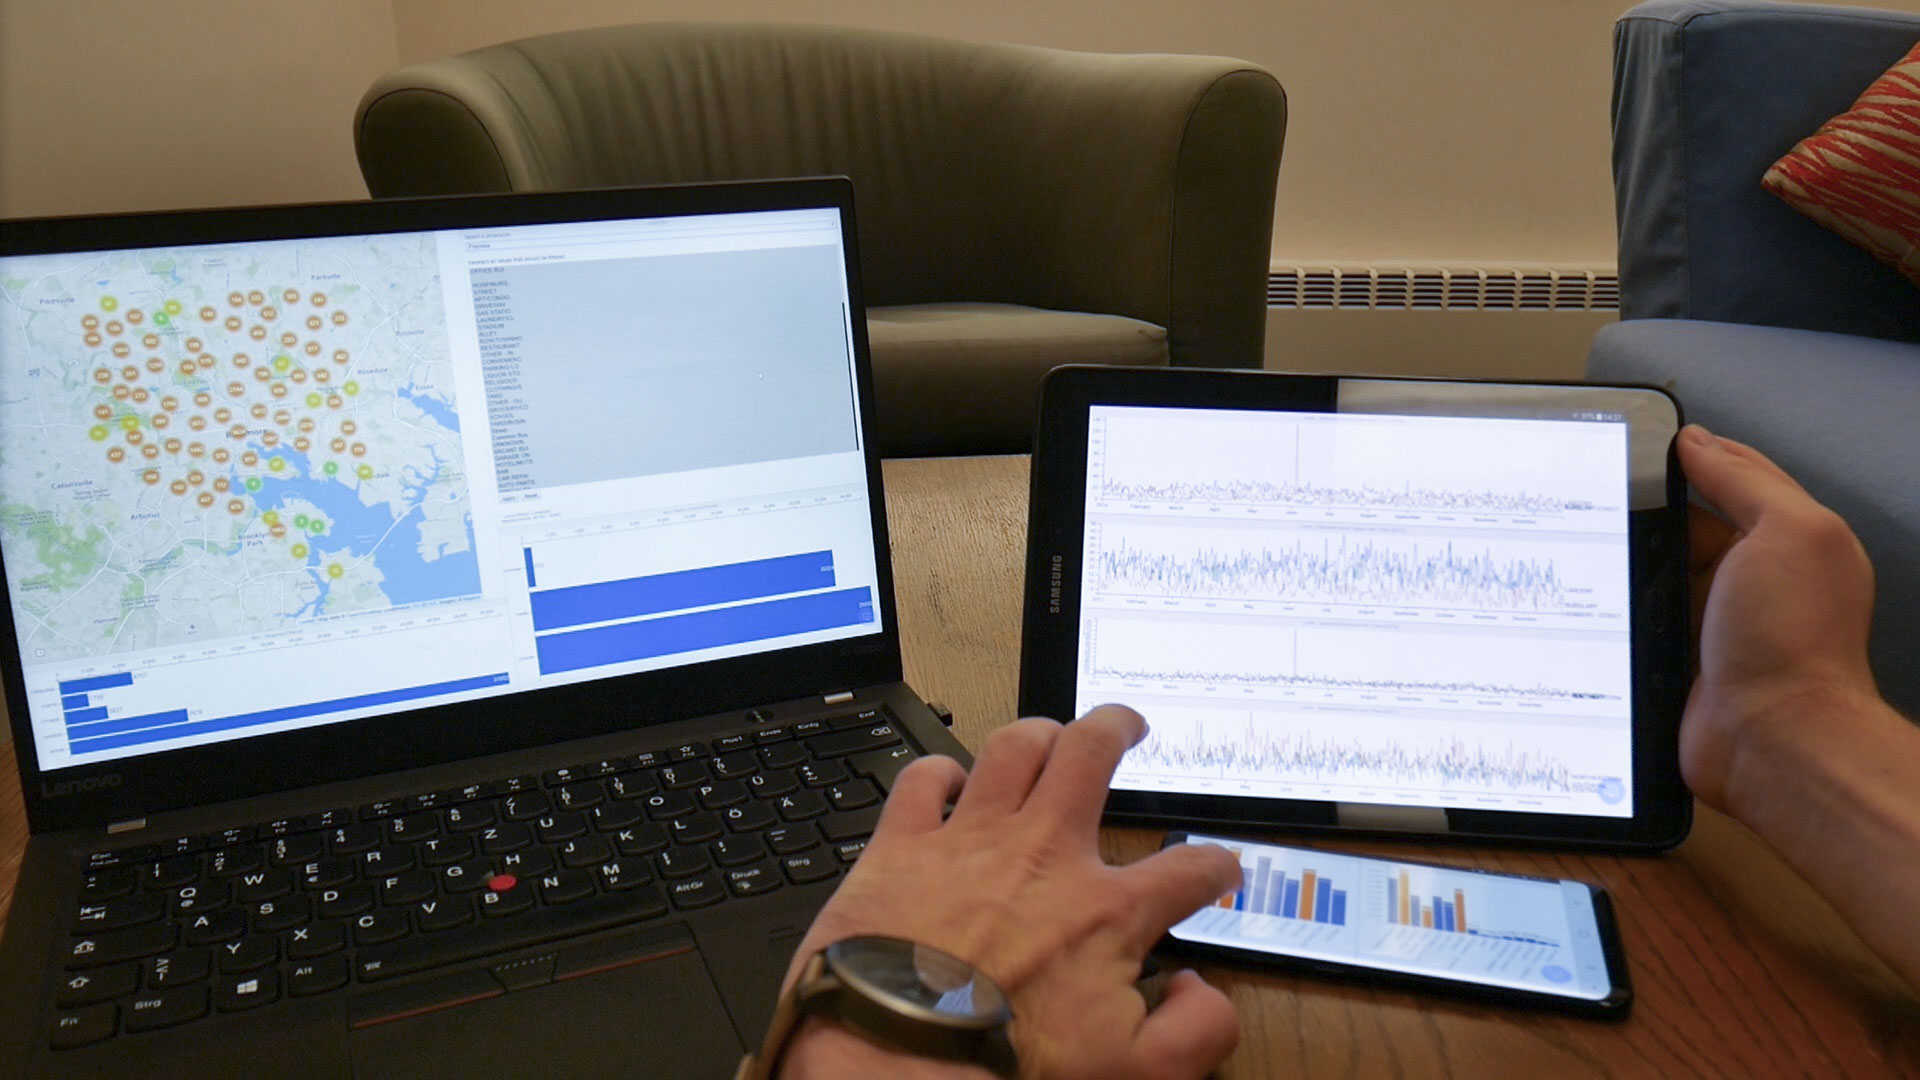
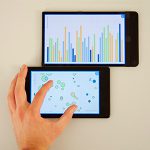
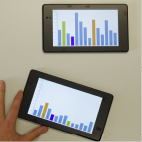
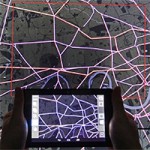
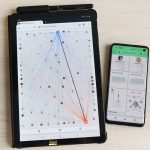
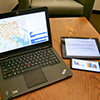
Building upon the considerations from the previous two parts, I have then investigated how visual data analysis can be supported in fully dynamic device ecologies. For that, I worked on an interaction design that allows for applying device coordination and view combinations in an ad-hoc fashion. Specifically, the conceptual framework called VisTiles focuses on exploiting changing physical device arrangements to resemble similar device roles as explored in the previous part of the dissertation topic. The flexibility of dynamic device ecologies also means that the present device setup can change often and that the interface has to be adapted accordingly. Here, I worked on the Vistribute framework, in which multiple heuristics are proposed that can support an automatic distribution of visualization views across available devices by considering
both view specifications and device properties. The accompanying implementation showed that the quality of such automatic distributions is rated by users similar to manually created ones, while notably reducing the setup effort. In sum, the works presented in this part provide concepts and approaches that can allow to actually enable visual data analysis in dynamic device ecologies and support a more natural way of conducting these analyses.
@article{Langner:2018aa,
author = {Ricardo Langner and Tom Horak and Raimund Dachselt},
title = {VisTiles: Coordinating and Combining Co-located Mobile Devices for Visual Data Exploration},
journal = {IEEE Transactions on Visualization and Computer Graphics},
volume = {24},
issue = {1},
year = {2018},
month = {1},
location = {Phoenix, Arizona USA},
pages = {626--636},
numpages = {11},
doi = {10.1109/TVCG.2017.2744019},
url = {http://dx.doi.org/10.1109/TVCG.2017.2744019},
publisher = {IEEE},
keywords = {collaboration, data visualization, mobile communication, prototypes, smart phones, visualization, mobile devices, coordinated \& multiple views, cross-device interaction, multi-display environment}
}Weitere Materialien
, Video
@inproceedings{Horak2019,
author = {Tom Horak and Andreas Mathisen and Clemens N. Klokmose and Raimund Dachselt and Niklas Elmqvist},
title = {Vistribute: Distributing Interactive Visualizations in Dynamic Multi-Device Setups},
booktitle = {Proceedings of the CHI Conference on Human Factors in Computing Systems},
year = {2019},
month = {5},
location = {Glasgow, Scotland, UK},
pages = {616:--616:13},
doi = {10.1145/3290605.3300846},
publisher = {ACM}
}Weitere Materialien
, Video
Further Publication
@inproceedings{Horak2020MultivariateNetworksMobile,
author = {Tom Horak and Ricardo Langner and Raimund Dachselt},
title = {Towards Visualizing and Exploring Multivariate Networks on Mobile Devices},
booktitle = {Companion Proceedings of the 2020 Conference on Interactive Surfaces and Spaces},
series = {ISS '20 Companion},
year = {2020},
month = {11},
location = {Virtual Event, Portugal},
pages = {5--8},
doi = {10.1145/3380867.3426201},
publisher = {ACM},
address = {New York, NY, USA}
}Weitere Materialien
@article{Mathisen:2019,
author = {Andreas Mathisen and Tom Horak and Clemens N. Klokmose and Kaj Grønbæk and Niklas Elmqvist},
title = {InsideInsights: Integrating Data-Driven Reporting in Collaborative Visual Analytics},
journal = {Computer Graphics Forum},
volume = {38},
issue = {3},
year = {2019},
month = {6},
location = {Porto, Portugal},
pages = {649--661},
doi = {10.1111/cgf.13717},
publisher = {Wiley Online Library}
}Weitere Materialien
@inproceedings{fixme,
author = {Tom Horak},
title = {Designing for Visual Data Exploration in Multi-Device Environments},
booktitle = {Extended Abstracts of the CHI Conference on Human Factors in Computing Systems},
year = {2019},
month = {5},
location = {Glasgow, UK, Scotland},
pages = {DC11:1--DC11:6},
doi = {10.1145/3290607.3299086},
publisher = {ACM},
address = {New York, NY, USA}
}Weitere Materialien
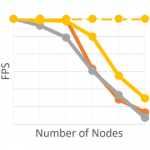
@inproceedings{fixme,
author = {Tom Horak and Ulrike Kister and Raimund Dachselt},
title = {Comparing Rendering Performance of Common Web Technologies for Large Graphs},
booktitle = {Poster Program of the 2018 IEEE VIS Conference},
year = {2018},
month = {10},
location = {Berlin, Germany},
numpages = {2}
}@inproceedings{fixme,
author = {Javid Abbasov and Tom Horak and Raimund Dachselt},
title = {Smartwatch-based Pointing Interaction},
booktitle = {Mensch und Computer 2018 - Tagungsband},
year = {2018},
month = {9},
location = {Dresden, Germany},
pages = {261--265},
doi = {10.18420/muc2018-mci-0373},
publisher = {Gesellschaft f\"{u}r Informatik e.V.}
}Weitere Materialien
@inproceedings{fixme,
author = {Ricardo Langner and Tom Horak and Raimund Dachselt},
title = {Demonstrating VisTiles: Visual Data Exploration Using Mobile Devices},
booktitle = {Proceedings of the 2018 International Conference on Advanced Visual Interfaces},
series = {AVI '18},
year = {2018},
month = {5},
isbn = {978-1-4503-5616-9},
location = {Castiglione della Pescaia, Grosseto, Italy},
pages = {69:1--69:3},
numpages = {3},
doi = {10.1145/3206505.3206583},
url = {http://doi.org/10.1145/3206505.3206583},
acmid = {3206583},
publisher = {ACM},
address = {New York, NY, USA}
}Weitere Materialien
Demonstrating David Meets Goliath: Combining Smartwatches with a Large Vertical Display for Visual Data Exploration
@inproceedings{Horak2018a,
author = {Tom Horak and Sriram Karthik Badam and Niklas Elmqvist and Raimund Dachselt},
title = {Demonstrating David Meets Goliath: Combining Smartwatches with a Large Vertical Display for Visual Data Exploration},
booktitle = {Extended Abstracts of the CHI Conference on Human Factors in Computing Systems},
series = {CHI EA '18},
year = {2018},
month = {4},
location = {Montreal, QC, Canada},
pages = {D414:1--D414:4},
doi = {10.1145/3170427.3186497},
url = {https://doi.org/10.1145/3170427.3186497},
publisher = {ACM}
}Weitere Materialien
, Video
@inproceedings{Horak2018b,
author = {Tom Horak and Raimund Dachselt},
title = {Hierarchical Graphs on Mobile Devices: A Lane-based Approach},
booktitle = {Proceedings of the CHI 2018 Workshop on Data Visualization on Mobile Devices},
series = {MobileVis '18},
year = {2018},
month = {4},
location = {Montreal, QC, Canada},
numpages = {7}
}Weitere Materialien
@inproceedings{fixme,
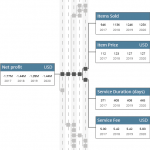
author = {Tom Horak and Ulrike Kister and Raimund Dachselt},
title = {Improving Value Driver Trees to Enhance Business Data Analysis},
booktitle = {Poster Program of the 2017 IEEE VIS Conference},
year = {2017},
month = {10},
location = {Phoenix, Arizona, USA},
numpages = {2}
}
@inbook{fixme,
author = {Ricardo Langner and Ulrich von Zadow and Tom Horak and Annett Mitschick and Raimund Dachselt},
editor = {Craig Anslow and Pedro Campos and Joaquim Jorge},
title = {Content Sharing Between Spatially-Aware Mobile Phones and Large Vertical Displays Supporting Collaborative Work},
booktitle = {Collaboration Meets Interactive Spaces},
year = {2016},
month = {12},
isbn = {978-3-319-45852-6},
pages = {75--96},
numpages = {22},
doi = {10.1007/978-3-319-45853-3_5},
url = {http://dx.doi.org/10.1007/978-3-319-45853-3_5},
publisher = {Springer International Publishing}
}Weitere Materialien
, Video
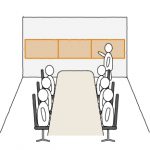
@inproceedings{fixme,
author = {Tom Horak and Ulrike Kister and Raimund Dachselt},
title = {Presenting Business Data: Challenges during Board Meetings in Multi-Display Environments},
booktitle = {Proceedings of the 2016 ACM International Conference on Interactive Surfaces and Spaces},
year = {2016},
month = {11},
isbn = {978-1-4503-4248-3},
location = {Niagara Falls, ON, Canada},
pages = {319--324},
numpages = {6},
doi = {10.1145/2992154.2996774},
url = {http://doi.acm.org/10.1145/2992154.2996774},
acmid = {2996774},
publisher = {ACM},
address = {New York, NY, USA},
keywords = {business data, multi-display environments, presentation}
}Weitere Materialien
@inproceedings{fixme,
author = {Tom Horak and Ulrich von Zadow and Matthias Kalms and Raimund Dachselt},
title = {Discussing the State of the Art for “in the wild” Mobile Device Localization},
booktitle = {ISS 2016 Workshop on Interacting with Multi-Device Ecologies "'in the wild"'},
year = {2016},
month = {11},
location = {Niagara Falls, ON, Canada},
numpages = {7}
}Weitere Materialien
@inproceedings{fixme,
author = {Ricardo Langner and Tom Horak and Raimund Dachselt},
title = {Towards Combining Mobile Devices for Visual Data Exploration},
booktitle = {Poster Program of the 2016 IEEE Conference on Information Visualization (InfoVis)},
year = {2016},
month = {10},
location = {Baltimore, MD, USA},
numpages = {2}
}Weitere Materialien
@inproceedings{fixme,
author = {Tom Horak and Ulrike Kister and Konstantin Klamka and Ricardo Langner and Raimund Dachselt},
title = {Logging in Visualizations: Challenges of Interaction Techniques Beyond Mouse and Keyboard},
booktitle = {Proceedings of the IEEE VIS 2016 Workshop on Logging Interactive Visualizations \& Visualizing Interaction Logs (LIVVIL)},
year = {2016},
month = {10},
location = {Baltimore, MD, USA},
numpages = {2}
}Weitere Materialien
@article{fixme,
author = {Wolfgang B\"{u}schel and Ricardo Langner and Ulrich von Zadow and Tom Horak and Raimund Dachselt},
title = {Towards Cross-Surface Content Sharing Between Mobile Devices and Large Displays in the Wild},
booktitle = {CHI 2016 Workshop on Interacting with Multi-Device Ecologies "'in the Wild"'},
year = {2016},
month = {5},
location = {San Jose, CA, USA},
numpages = {5}
}Weitere Materialien
Related Student Theses

Responsive Graphs: Anpassung von Node-Link Diagrammen für Mobilgeräte
Tobias Knothe 19. Juni 2020 bis 20. November 2020
Betreuung: Tom Horak, Eva Goebel, Raimund Dachselt
Responsive Visualizations: Systematische Betrachtung und Charakterisierung
Eva Goebel 19. Juli 2019 bis 20. Dezember 2019
Betreuung: Tom Horak, Tamara Flemisch, Raimund Dachselt

Strategien zur Anpassung von Visualisierungen in Dashboards für die Nutzung auf Mobilgeräten
Lars Arne Beck 24. Mai 2019 bis 8. Dezember 2019
Betreuung: Tom Horak, Tamara Flemisch, Raimund Dachselt

Visuelle Datenexploration von Graphen mit geräteübergreifenden Workflows zwischen einem großen Display und Mobilgeräten
Elisabeth Baudisch 23. Februar 2018 bis 22. September 2018
Betreuung: Tom Horak, Ricardo Langner, Raimund Dachselt

Pointing Interaction with Mobile Devices Using Internal Sensors
Javid Abbasov 2. Oktober 2017 bis 12. März 2018
Betreuung: Tom Horak, Raimund Dachselt
Interaktives Vergleichen von Graphen auf Mobilgeräten
Florian Semt 19. Juni 2020 bis 4. September 2020
Betreuung: Tom Horak, Ricardo Langner, Raimund Dachselt

Neuartige Ansätze zur Visualisierung und Interaktion mit Daten auf Smartwatches
Anselm Bunsen 7. Juni 2019 bis 23. August 2019
Betreuung: Tom Horak, Konstantin Klamka, Raimund Dachselt

Semi-automatische Bearbeitung von Elementen und Layout multivariater Graphvisualisierungen
Antonio Pietzsch 15. Dezember 2017 bis 2. März 2018
Betreuung: Tom Horak, Ulrike Kister, Raimund Dachselt

Performanceanalyse und –optimierung von Web-basierten multivariaten Graphvisualisierungen
Robin Thomas 24. November 2017 bis 9. Februar 2018
Betreuung: Tom Horak, Ulrike Kister, Raimund Dachselt

Eingebettete Mikro-Visualisierungen in interaktiven Matrix-Visualisierungen von multivariaten Graphen
Paul Hoffmann 24. Mai 2019 bis 11. Oktober 2019
Betreuung: Tom Horak, Raimund Dachselt