
Exploring the manifold possibilities of data visualization on foldable mobile devices.
Abstract
With this work, we explore the unique potential of data visualization on novel foldable mobile devices (foldables). Even though foldables are already commercially available, there is limited knowledge of how to leverage their distinct characteristics for visualization. This gap will only grow as their form factors become increasingly diverse. To address this, we use a two-step approach. First, we present a device-centered design space, structured around physical and usage properties of foldable devices. Second, we introduce a conceptual framework that investigates visualization on foldables from four complementary perspectives: More Displays – distributing multiple views to leverage additional display space; More Shapes – mapping visualizations to spatial fold states; More Interactions – coupling visualization tasks and folding interactions; and More States – enabling responsive visualization through folding. We complement the design space and conceptual framework with a low-fidelity ideation workshop and the subsequent prototyping of interactive artifacts. We reflect on the results and lessons learned from our exploratory, design-driven process and discuss opportunities and challenges, including the gap between our proposed concepts and commercially available foldable devices. By providing conceptual foundations and illustrating the potential of foldables, we hope to inspire and inform the development of future visualization applications for this evolving class of devices.
Research Article
Design Space of Foldables
Foldable devices’ reconfigurable physical forms fundamentally affect how visual content is displayed and interacted with. To capture this, we constructed a device-centered design space by surveying commercial products, research prototypes, and non-digital folding artifacts.

Visualization Concepts for Foldables
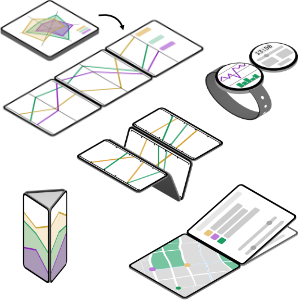
Our framework organizes visualization concepts along four complementary perspectives that leverage the unique characteristics of foldables.
- More Displays
Unfolding provides additional screen space for distributing multiple coordinated views, offloading UI components, and separating detail-and-context views across panels.
- More Shapes
Foldables assume spatial configurations beyond flat surfaces. Visualization structures can be aligned with physical seams, and views can be spatialized across angled or volumetric fold states.
- More Interactions
Folding becomes an input modality for visualization tasks, enabling exploration through continuous angle control, slice & filter via parameter mapping, and physical transitions between comparison strategies.
- More States
Fold-state transitions act as physical breakpoints for responsive visualization. They can trigger changes in detail level, visual encoding, device role, and collaboration setup.
Concept Illustrations




Prototyping of Foldable Visualizations


Ideation Workshop
We conducted a workshop with 15 participants who created 19 paper prototypes exploring diverse form factors and visualization concepts. Many concepts focused on small, portable, or wearable devices, especially for health monitoring and activity tracking. The prototypes explored various non-rectangular panel shapes, as well as linear, non-linear, and branched connection structures. Participants explored how foldables can distribute views and controls across panels, adapt visualizations through changing fold states, and use folding itself as part of the interaction.
Interactive Prototypes
We explored four prototyping strategies, each with different trade-offs between physical realism, interaction fidelity, and form-factor flexibility.
- Commercial foldables: highest physical and interaction realism but limited to available form factors.
- Combined smartphones with 3D-printed hinges: supports folding interaction with real displays.
- MR overlays on cardboard: great form-factor flexibility with limited interaction support.
- Rendered video animations: maximum design freedom, but non-interactive.
Supplemental Material
Further information can be found in the supplemental material osf repository.
Publication
@article{Baader:ManyFold:2026,
author = {Julian Baader and Ricardo Langner and Can Liu and Raimund Dachselt},
title = {ManyFold: A Design Exploration of Data Visualization on Foldable Mobile Devices},
journal = {IEEE Transactions on Visualization and Computer Graphics},
year = {2026},
month = {11},
location = {Boston, USA},
publisher = {IEEE}
}List of additional material
Acknowledgments
We thank Petra Isenberg for commenting on early ideas and concepts, Memoria Hu, Michelle Pattikawa, and Omar Taher for contributing as student assistants, and the anonymous reviewers for their valuable input. We thank Schloss Dagstuhl – Leibniz Center for Informatics and the participants of the seminar 25082 for the opportunity to discuss early ideas of this work.
Part of this work was funded by the Deutsche Forschungsgemeinschaft (DFG, German Research Foundation) – 545609014; by the DFG as part of Germany’s Excellence Strategy – EXC 2050/2 – Project ID 390696704 – Cluster of Excellence “Centre for Tactile Internet with Human-in-the-Loop” (CeTI) of TUD Dresden University of Technology; as well as the German Federal Ministry of Research, Technology and Space (BMFTR, SCADS22B) and the Saxon State Ministry for Science, Culture and Tourism (SMWK) by funding the competence center for Big Data and AI “ScaDS.AI Dresden/Leipzig”. Part of this work was supported by the National Natural Science Foundation of China under project No. 62202397.