3D Node-link diagrams are an important class of visualization for immersive analysis. Yet, there is little knowledge on how to design them to support efficient analysis. In two user studies we examined the design space for edge styles in Augmented Reality graph visualization.
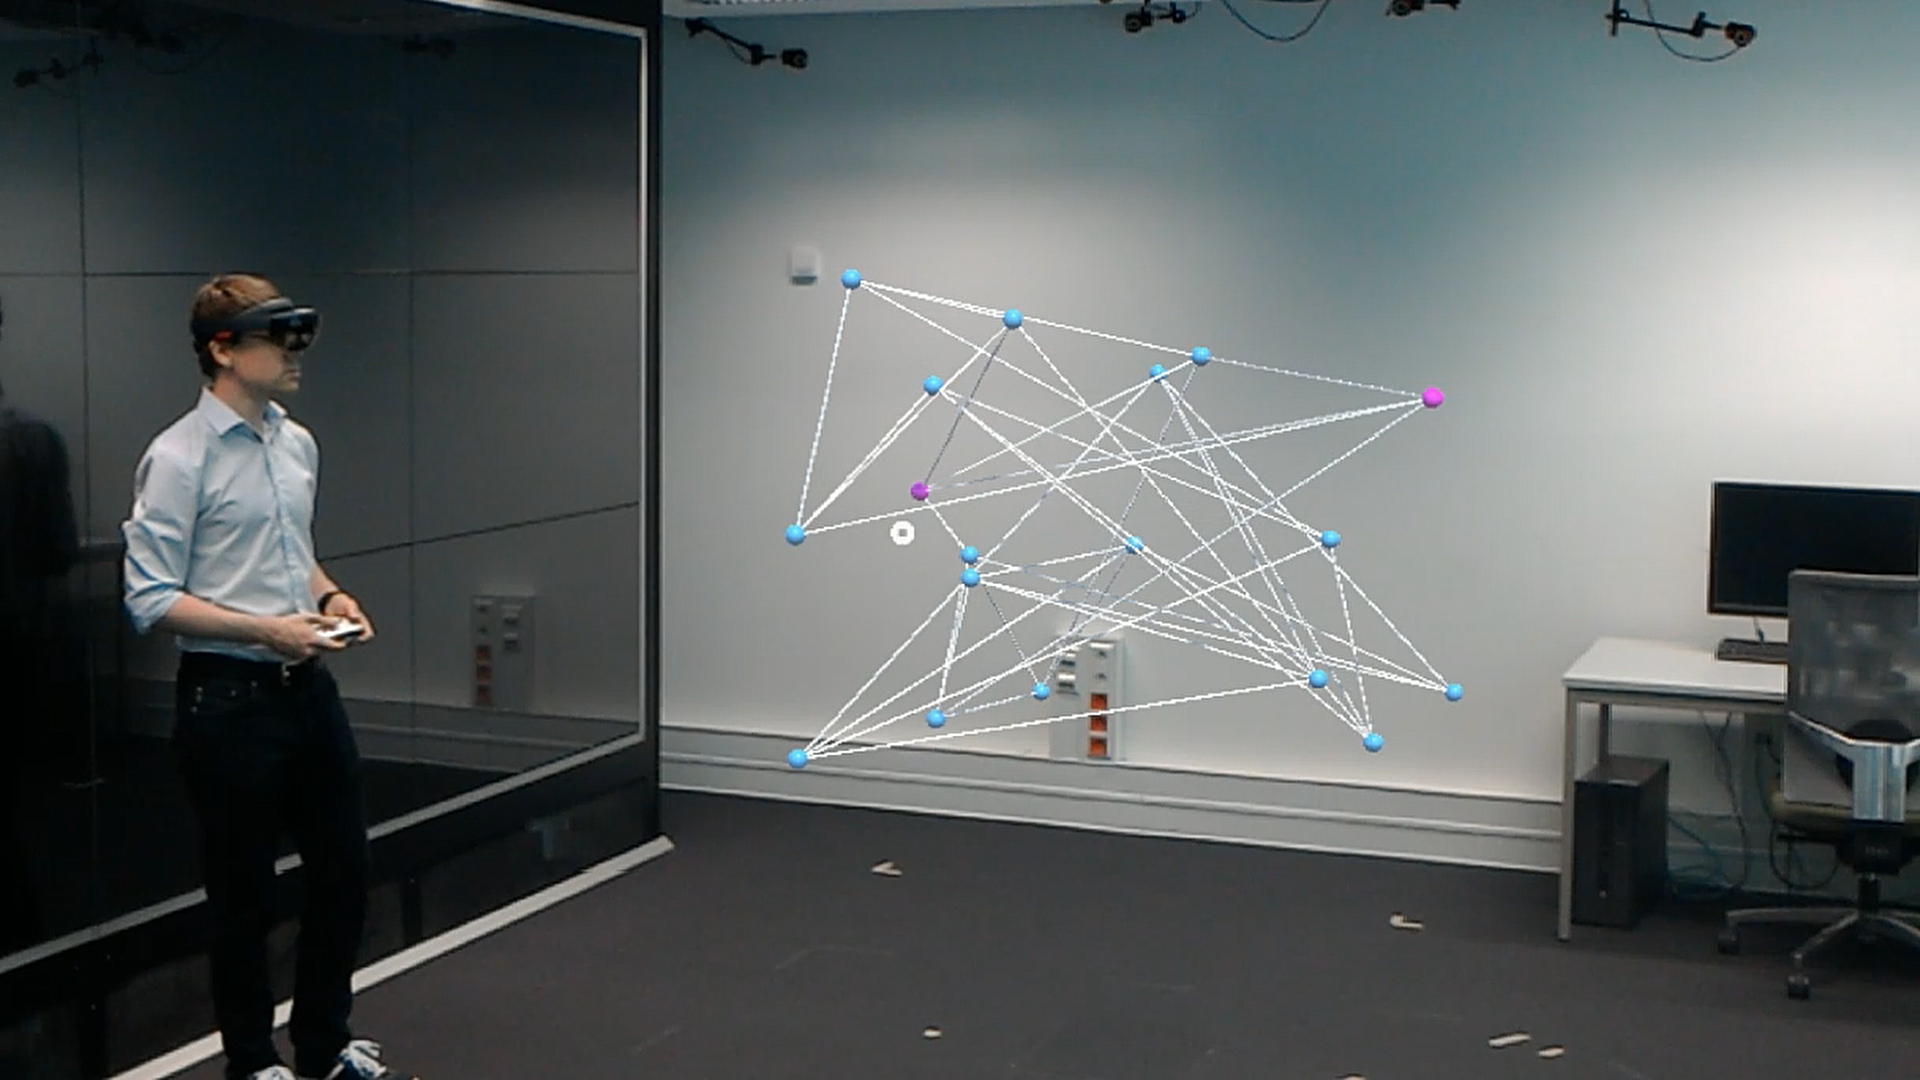
Table of Contents
Summary
Augmented Reality (AR) technologies can provide immersive, stereoscopic experiences in 3D without losing the connection to the environment or other people. Thus, it has a strong potential for collaboration among experts while integrating real world environments and virtual content. With new, complex AR systems for use cases such as maintenance assistance or cyber physical production systems, the need to visualize relations between both real objects and virtual parts of the AR scene will increase. Examples for such relations are computer networks integrated into the environment, information flows in a smart home, and many more. Typically, they are visualized as 3D node-link diagrams. However, as of yet, there has been little research on how to design immersive AR node-link visualizations. In this project we focus on how to design visualizations for edges specifically. So far, we conducted two studies in which we examined which visual variables are most suitable and how different edge styles perform compared to each other.
Link Attributes for Network Visualization
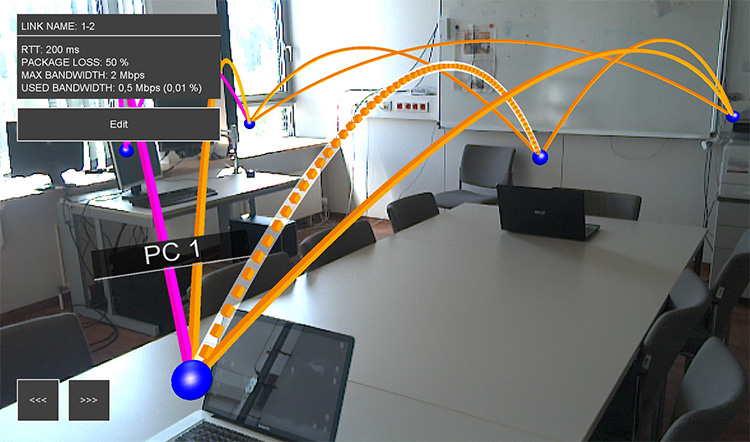
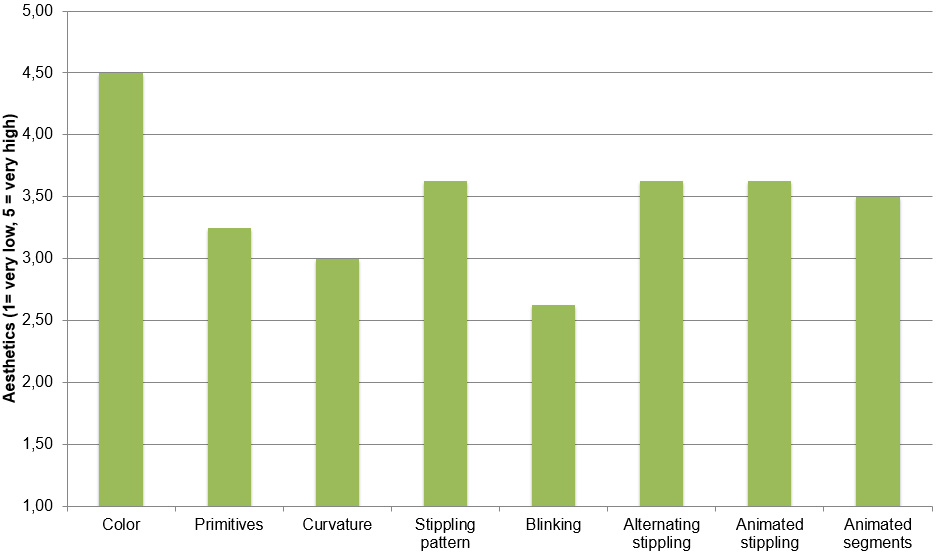
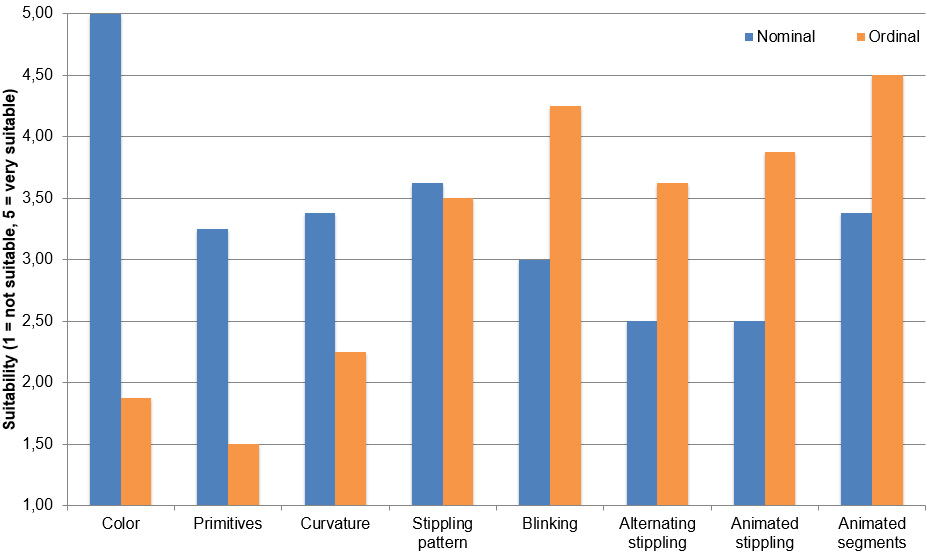
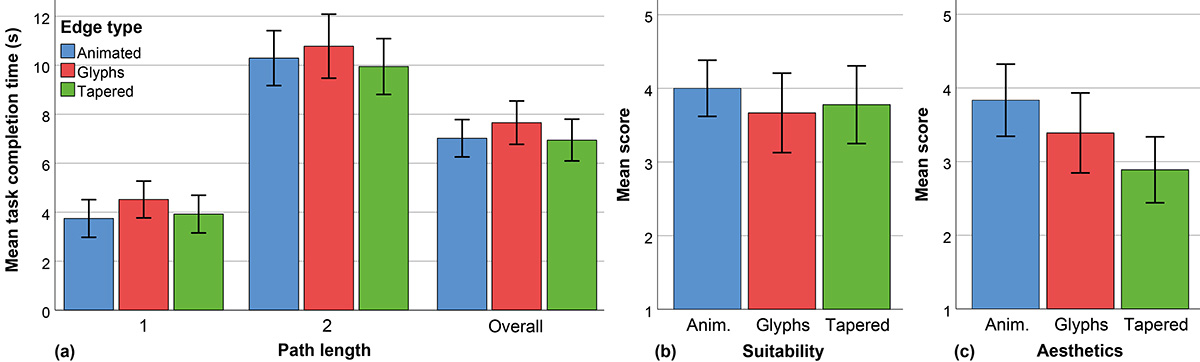
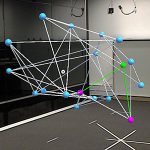
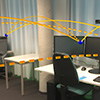
One specific use case of immersive 3D node-link diagrams is the visualization of network connections and their edge attributes, e. g., to show link capacity or connectivity in LAN or IoT networks. So far, however, there has been very little research on which visual variables to use. We implemented eight link variants and report on the findings of an initial study in which we compared these different visual variables for edge attributes in 3D AR node-link diagrams. The variants/edge styles that we compared in our study were color, geometric primitives, curvature, stippling patterns, blinking, alternating stippling, animated stippling, and animated segments.
Study Results
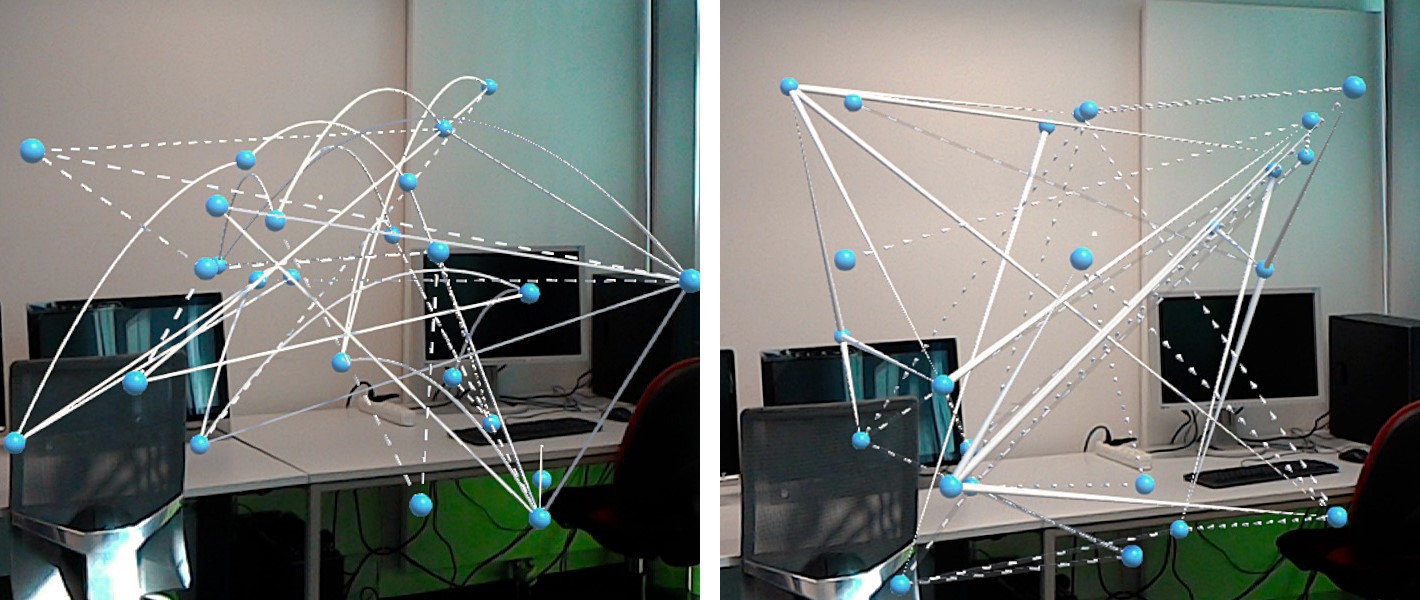
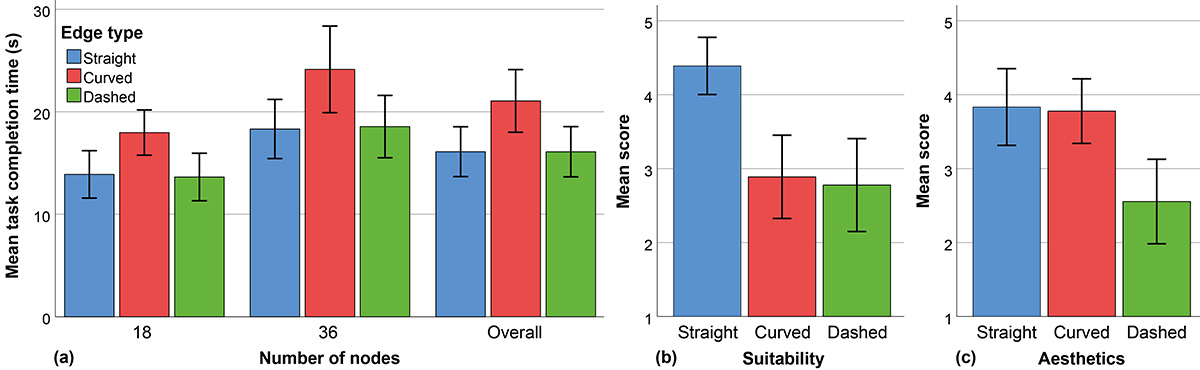
Visual Styles in 3D Node-Link Diagrams
Study Results
Related Publications
@article{fixme,
author = {Wolfgang B\"{u}schel and Stefan Vogt and Raimund Dachselt},
title = {Augmented Reality Graph Visualizations: Investigation of Visual Styles in 3D Node-Link Diagrams},
journal = {IEEE Computer Graphics and Applications},
volume = {39},
number = {3},
year = {2019},
month = {2},
isbn = {0272-1716},
pages = {29--40},
numpages = {12},
doi = {10.1109/MCG.2019.2897927},
url = {https://doi.org/10.1109/MCG.2019.2897927},
publisher = {IEEE}
}
@inproceedings{Bueschel2018b,
author = {Wolfgang B\"{u}schel and Stefan Vogt and Raimund Dachselt},
title = {Investigating Link Attributes of Graph Visualizations in Mobile Augmented Reality},
booktitle = {CHI 2018 Workshop on Data Visualization on Mobile Devices},
series = {CHI '18},
year = {2018},
month = {4},
location = {Montreal, QC, Canada}
}List of additional material
Related Student Theses

Investigation of Edge Visualization for Spatial 3D Node Link Diagrams
Stefan Vogt October 9th, 2017 until April 8th, 2018
Supervision: Wolfgang Büschel, Raimund Dachselt

Mobile 3D Network Visualization in Augmented Reality Environments
Sinthujan Thanabalasingam November 21st, 2016 until February 5th, 2017
Supervision: Wolfgang Büschel, Raimund Dachselt
Mobile Visualization of Networks in Augmented Reality Environments
Georg Eckert April 4th, 2016 until June 26th, 2016
Supervision: Wolfgang Büschel, Raimund Dachselt
Investigation of 3D Node Link Diagrams for the Visualization of Virtual Private Networks
Stefan Vogt February 13th, 2017 until June 12th, 2017
Supervision: Wolfgang Büschel, Raimund Dachselt